JMeter Fury Fleet: AI Agents for Smarter Load Testing
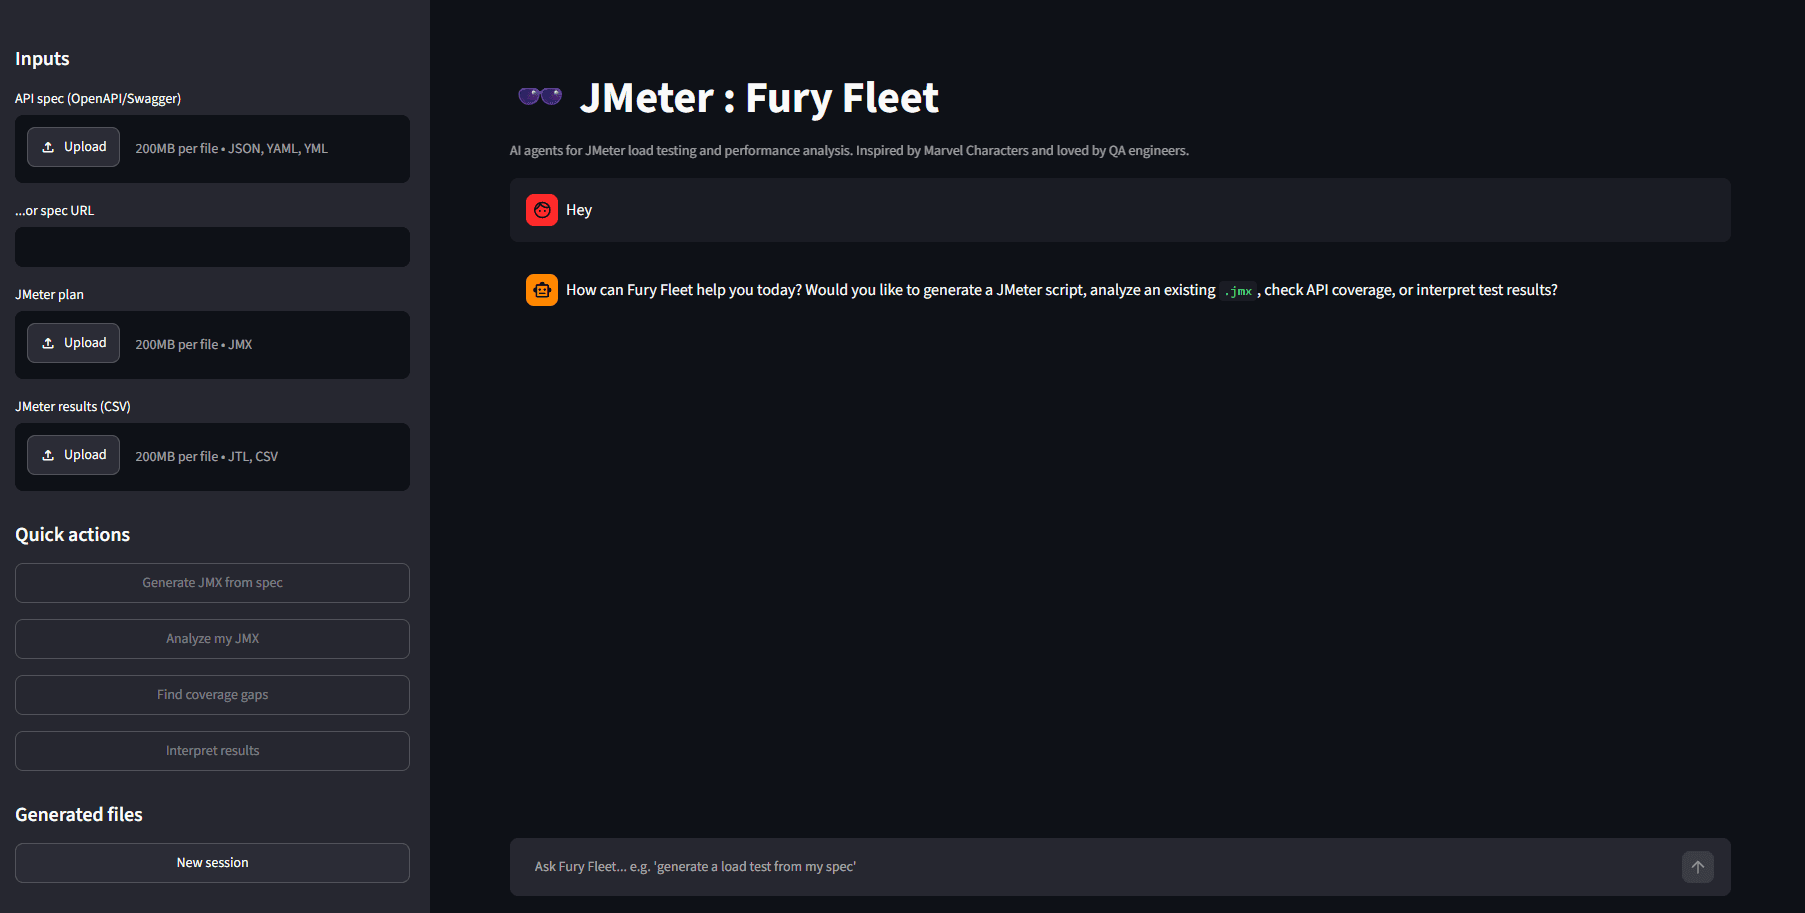
Fury Fleet is an AI-powered suite that streamlines JMeter performance testing by automating test plan generation, analysis, and coverage checks. Built with Python, Google ADK, and Streamlit, it leverages deterministic tools for data and AI agents for insights, making performance testing more accessible and actionable.
Fury Fleet is my attempt to bring AI agents into the world of JMeter performance testing. Inspired by Feather Wand, I'm building it as a standalone web application using Python, Google ADK, and Streamlit, with a fleet of agents working together to simplify every stage of performance testing.
My goal: make performance testing easier, from creating test plans to understanding test results.
With Fury Fleet, you can:
Generate JMeter test plans from OpenAPI/Swagger specs.
Review existing .jmx files and spot issues in the test design.
Compare API specs with test plans to find endpoints that aren’t covered.
Analyze JMeter results (.jtl) to understand latency percentiles, error rates, degradation, and possible bottlenecks.
Consider rephrasing to 'My principle: let deterministic code handle data processing, and use AI for interpretation and suggestions.' Consider softening to 'minimizes hallucinated XML and guessing' or clarifying the limits of this approach.
Goals, Scope, and Non-goals
Goals
A working MVP usable by practicing performance engineers.
In Scope
HTTP/REST testing
OpenAPI 3 and Swagger 2 specs
CSV JTL files
Single-user browser sessions
Non-goals (for now)
Running JMeter itself
Non-HTTP protocols
XML JTL files
Persistent history
Per-user authentication
Distributed load generation
Architecture
System Context
Layers and Components
Layer Responsibilities
Layer
Responsibility
Presentation
Uploads, quick actions, chat, download buttons, access gate, message cap
Orchestration
Session lifecycle, running agents, event stream, routing by the root agent
Agents
Prompts and tool selection for one job each
Tools
All parsing, generation, statistics, and rule checks; all file and URL access goes through safety
Request Routing
Technology Stack
Concern
Choice
Language
Python 3.12+
Agent framework
google-adk
Model
Gemini 2.5 Flash via Vertex AI (model name set once in config.py)
UI
Streamlit
Parsing
xml.etree.ElementTree, PyYAML
Analytics
pandas
The Agents
#
Agent
Purpose
Tools
State written
1
fury_fleet (root)
Coordinator, routes to a specialist
none (uses sub_agents)
none
2
script_generator
Spec in, JMX out
parse_openapi, generate_jmx, analyze_jmx
generated_jmx_path, jmx_analysis
3
jmx_analyzer
Review an existing JMX
analyze_jmx
jmx_analysis
4
coverage_gap
Find untested endpoints
find_coverage_gaps
none (reads jmx_analysis)
5
results_interpreter
Interpret JTL results
analyze_jtl
jtl_analysis
Behavior Notes
Consider splitting into two sentences or adding an example for clarity.
script_generator calls parse_openapi, then generate_jmx, then analyze_jmx on its own output as a sanity check. It never claims that the test was executed.
results_interpreter uses p95 SLA 1000 ms and 1.0% error limit if the user gives none, and says so. It It labels possible causes as hypotheses rather than facts.
jmx_analyzer It reports only findings returned by the tool and never invents issues.
coverage_gap It reports the coverage percentage, lists uncovered endpoints grouped by reads and writes, and identifies JMX requests not present in the spec.
Tools Reference
6.1 analyze_jmx (jmx_tools.py)
analyze_jmx_file is a pure function: parses XML, walks enabled elements, collects thread groups, HTTP samplers, timers, assertions, and memory-heavy listeners.
analyze_jmx wraps it and caches the result in session state.
Finding
Severity
Condition
No samplers
high
No enabled HTTPSamplerProxy
Instant spike
high
>10 threads with ramp-up 0
Never stops
high
loops = -1 and scheduler off
No think time
medium
Samplers exist but no timers
No assertions
medium
Samplers exist but no assertions
Heavy listeners
medium
View Results Tree, Table, or Graph enabled
Hardcoded host
low
Sampler domain is not a variable
Limits: HTTP samplers only; children of a disabled parent are still counted; property expressions like ${__P(threads,50)} are not evaluated.
6.2 parse_openapi and Helpers (openapi_tools.py)
load_spec: reads file or http(s) URL, JSON or YAML.
server_info: handles OpenAPI 3 servers and Swagger 2 host, schemes, basePath, including relative server URLs.
sample_value: builds realistic values from a schema: example, default, enum, allOf/oneOf/anyOf, type-based values. Resolves $ref, stops at depth 5.
extract_endpoints: flattens the spec into method, path, path params, required query params, JSON body, expected 2xx status.
6.3 generate_jmx (jmx_generator.py)
Plan is assembled with ElementTree, parameterized for command-line tuning:
User Defined Variables: protocol, host, port, token placeholder, path param defaults.
HTTP Request Defaults: use ${host}, ${port}, ${protocol}.
A path template like /users/{id} becomes a regex matching /users/42 and /users/${id}. The spec base path is stripped from sampler paths before matching. If the same JMX was already analyzed in this session, the cached parse is reused.
6.5 analyze_jtl (jtl_tools.py)
Statistics: samples, error percent, average, p50, p90, p95, p99, max, duration, throughput—overall and per label. Timeline is built only if the run lasts at least 10 seconds and has at least 50 samples.
Finding
Severity
Condition
Low sample count
medium
Fewer than 100 samples
p95 over SLA
high
Overall p95 above the SLA
Error rate over limit
high
Overall error percent above the limit
Slow endpoints
high
Per-label p95 above the SLA (top 3)
Error-prone endpoints
high
Per-label error percent above the limit (top 3)
Degradation
high
Median p95 of last 3 windows >1.5x first 3 and >100ms higher
Error spike
high
A window's error percent exceeds max(5, 3x overall rate)
Workflow
The Entire MVP Working, End to End
8.1 User Journey
In plain words: a tester brings an API spec, a plan, or a results file. The app saves each upload to that browser session's workspace, tells the agents the exact paths, and routes the request to the right specialist. The specialist calls deterministic tools for facts; the model explains them. Generated plans come back as downloads, and the loop closes when the plan is run in JMeter and the resulting .jtl is fed back for interpretation.
8.2 How Agents Share State
State lives for the session only. The coverage tool reuses a cached JMX parse only when the cached source_path matches the requested file.
Known Limitations
HTTP/REST only; other samplers and protocols are ignored by the analyzer.
CSV JTL only; XML JTL is rejected with a clear error.
JMX property expressions like ${__P(threads,50)} are not evaluated, and children of a disabled parent are still counted.
The generator builds a single thread group that covers all endpoints, without simulating user sessions, authentication flows, or realistic multi-step journeys.
Sessions and files are in memory and on local disk. No history, no multi-instance scaling.
The agents do not run JMeter and cannot measure anything themselves.

Join the discussion
Nothing here yet — be the first to weigh in.